Asset Directory
A list of all the batteries in each region, and what they're doing.
Modo makes available a directory of every operational battery resource on ERCOT, including details about the site and its historical revenue performance.
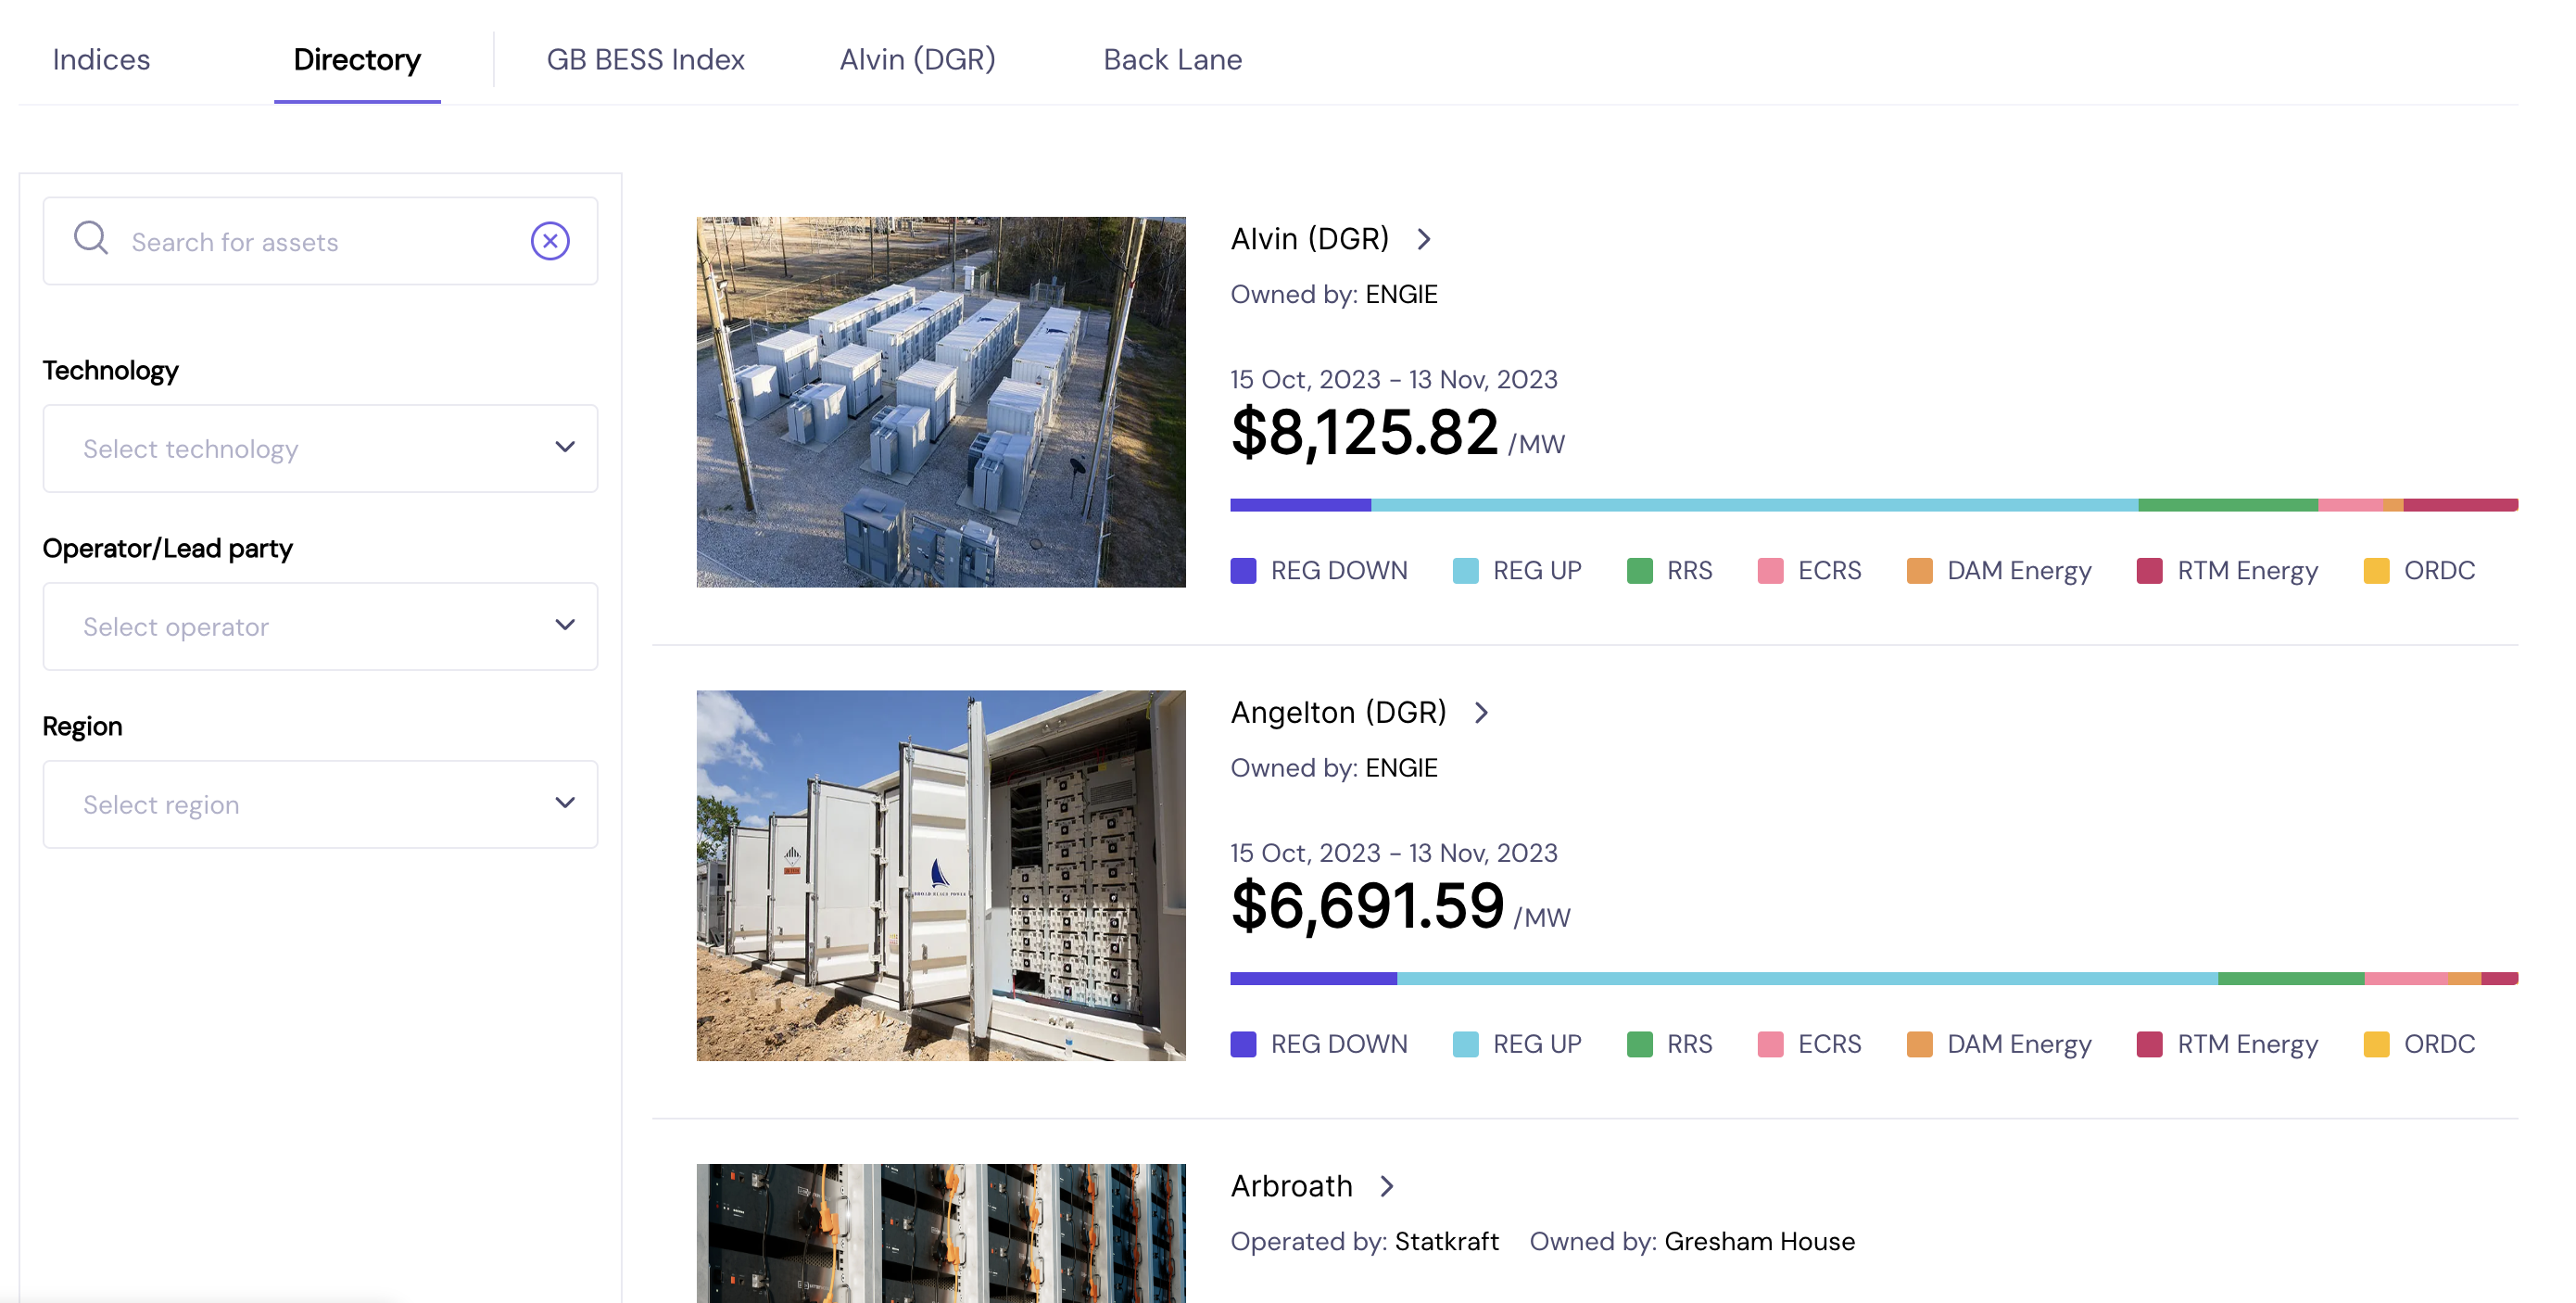
Use the Directory to explore operational assets and understand which markets they participate in
Searching for assets
You can filter the directory by:
- Technology - the resource's generation technology.
- Operational assets of every major generation technology are listed in the directory, but only "BESS" assets have full details and revenue breakdowns. Select "BESS" technology from the dropdown to see all battery assets.
- Operation / Lead party - the party trading the asset.
- Region - ERCOT or GB.
For each field, you can select as many values as you like.
Asset details
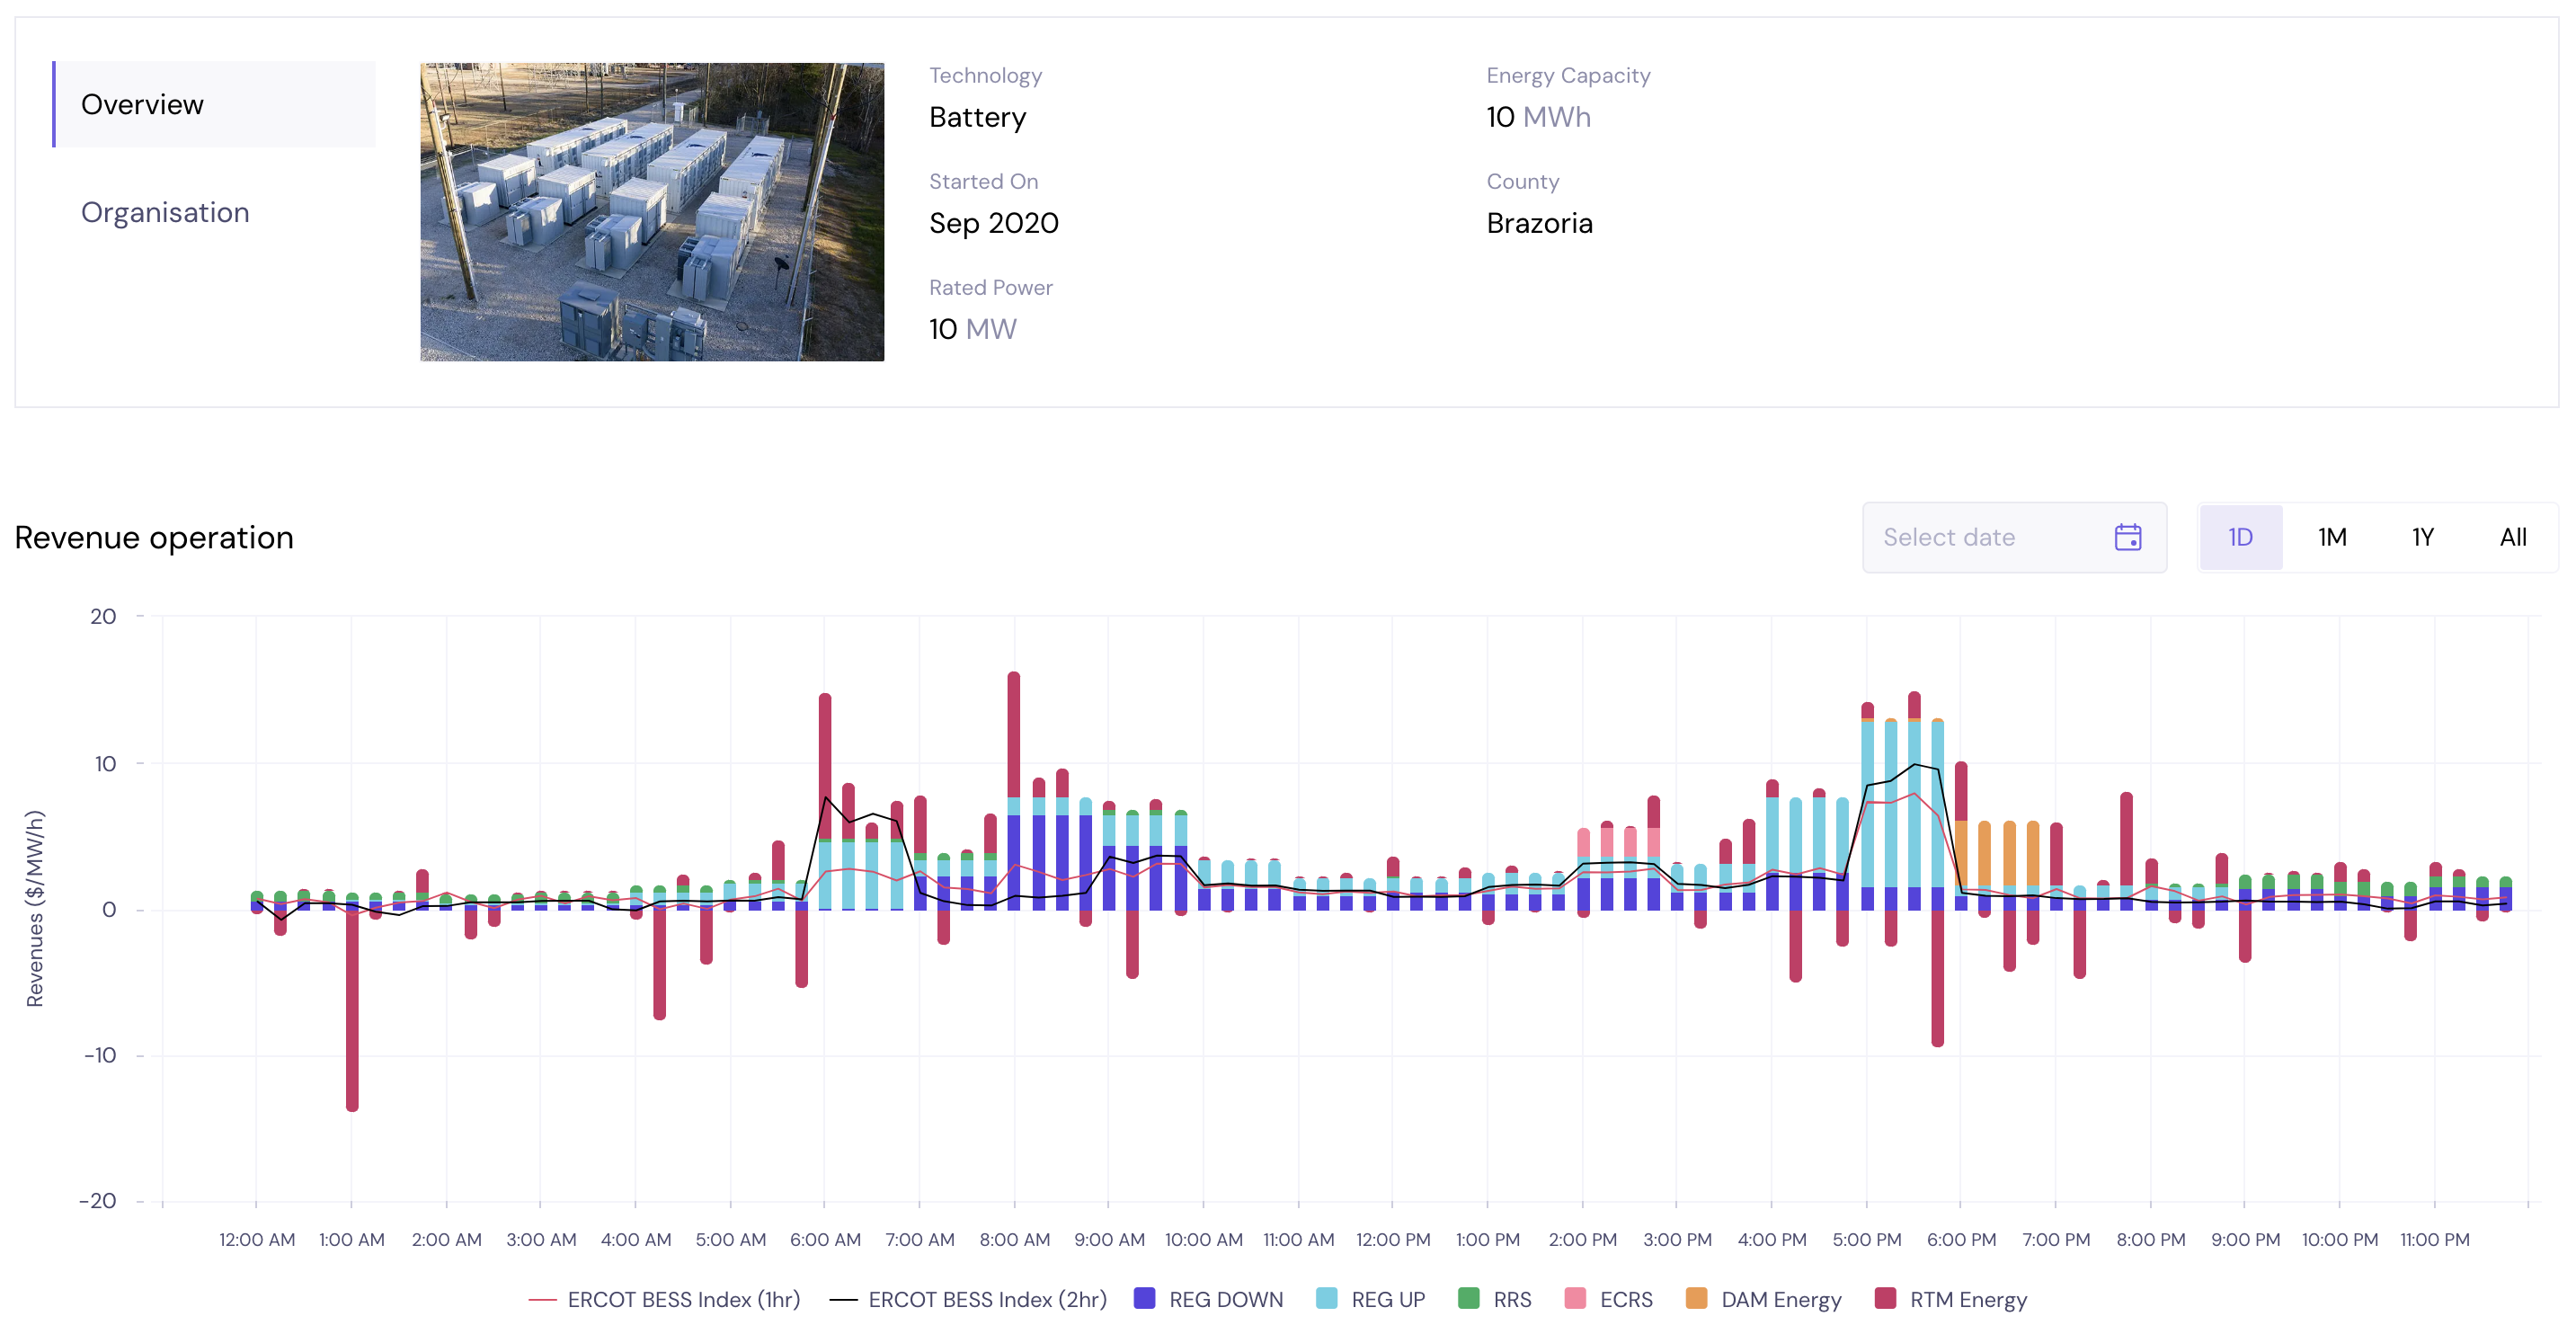
The view of an asset's details and revenue
For each battery asset in our directory, we make available the following details:
- Energy capacity - the quantity of energy (MWh) the asset can store.
- Rated power - the maximum power (MW) that the asset can import/export. Rated power is sometimes different for importing versus exporting, but significant differences are uncommon so for our purposes we assume that rated power is the same for importing and exporting.
- Photo - a photo of the actual site if available, or a stock image otherwise.
- Started on - the date when the battery first began to operate. In other words, this is the date when they first appeared in market data.
- County - the political subdivision in which the battery is physically located.
- Owner - the entity that owns the battery.
- Operator - the entity that controls and trades the battery.
- Market IDs - the Qualified Scheduling Entity (QSE) and Decision Making Entity (DME) IDs associated with the battery.
Timeframe-dependent data
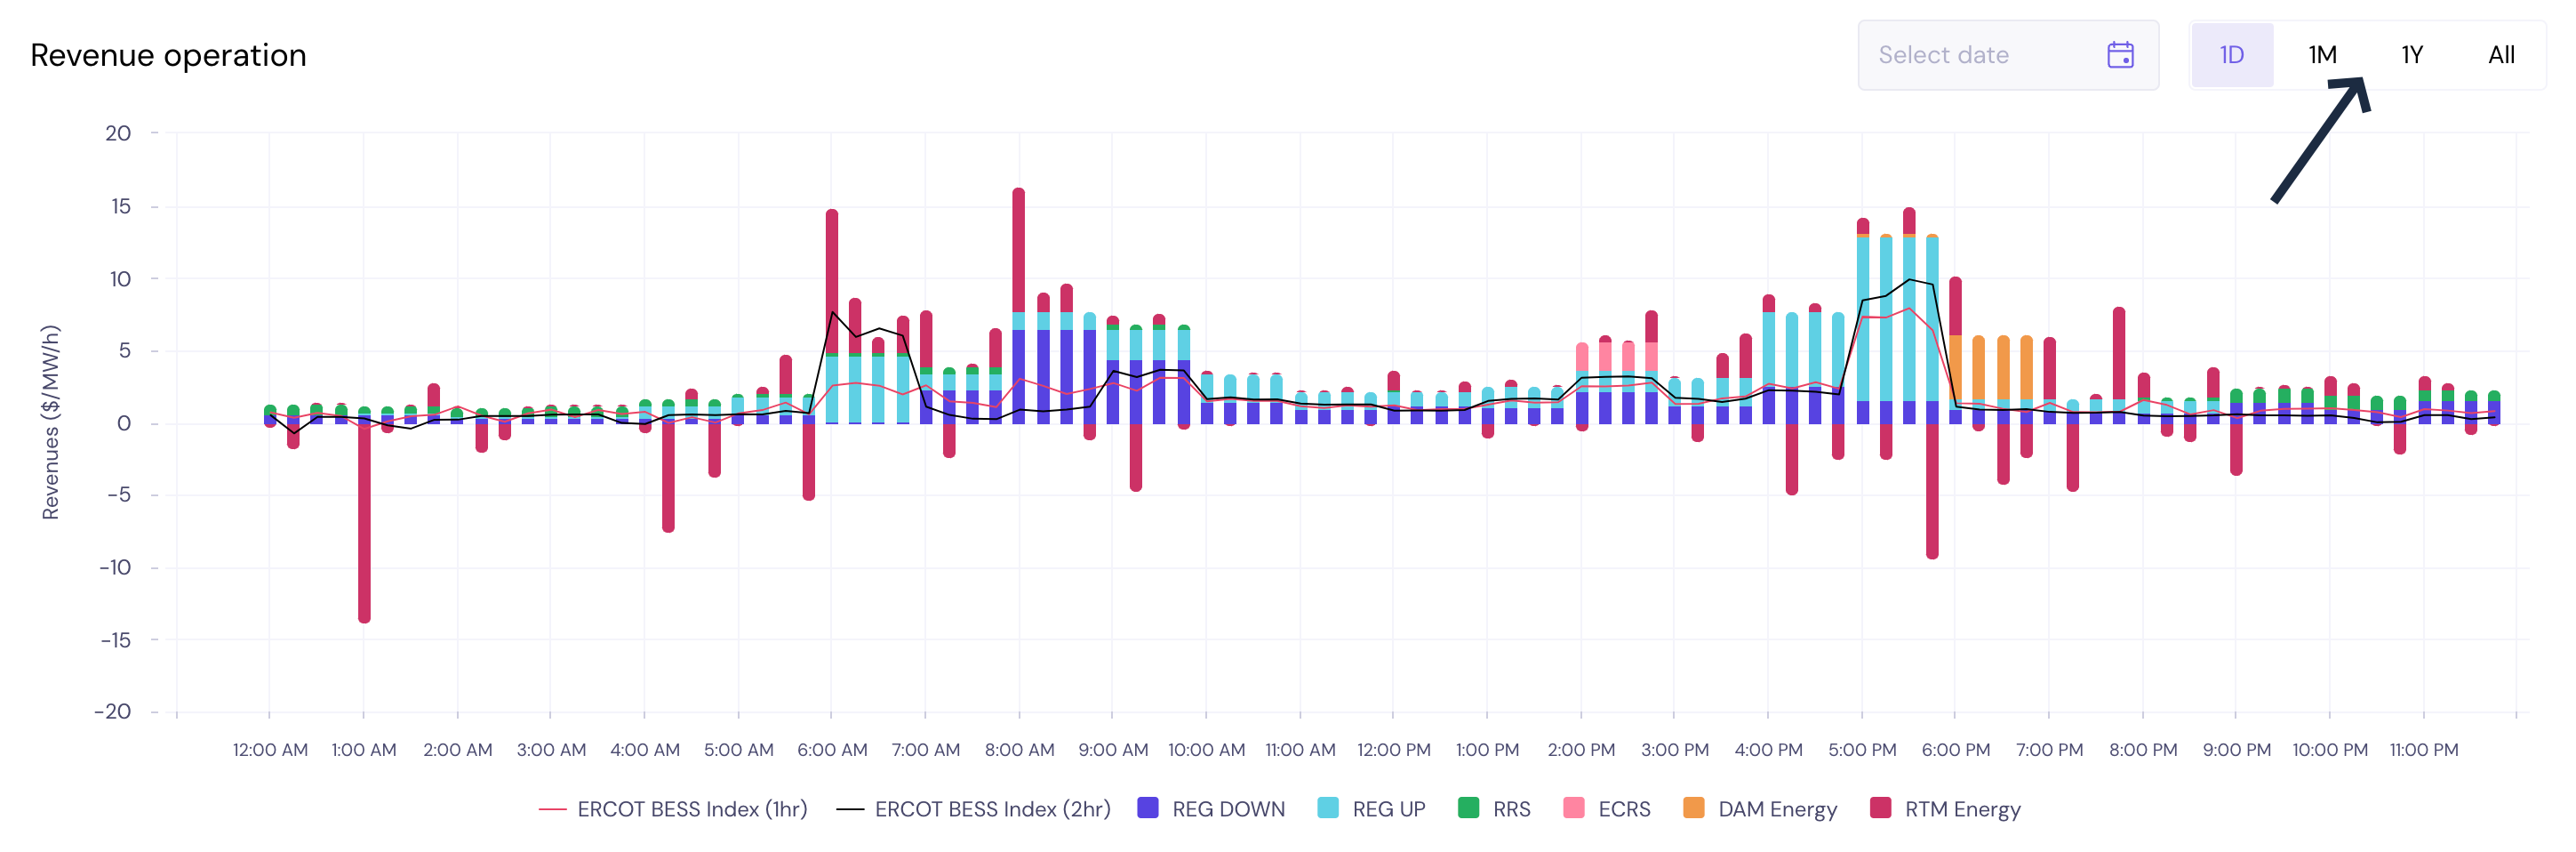
Select the timeframe you want to see data for in the upper right-hand corner. Click "Select date" in the box to the left to choose the date the focus the timeframe on.
Revenue operations
This time series chart's stacked bars show the asset's revenue for each period, broken down into Ancillary Services, Day-Ahead Energy (DAM), and Real-Time Energy (RTM). The lines show the combined revenue across all sources for only batteries with a 1-hour duration versus a 2-hour duration. A battery's duration is found by dividing its storage capacity by its rated power.
Revenue is shown as dollars per megawatt of the asset's rated power so that assets of different sizes can be compared apples-to-apples.
The time granularity and revenue units will change depending on which timeframe you select. The 1-Day view shows 15-minute periods and measures revenue as $/MW/h. The 1-Month view shows daily periods and measures revenue as $/MW/year.
For details on how these numbers are calculated, please read the page on Wholesale Energy and Ancillary Services.
Physical operations
This is a time series line graph showing the quantity of power (MWs) exported or imported by the asset at each period. If the value is greater than 0MW, the battery was exporting energy onto the grid (discharging). If the value was less than 0MW, the battery was importing power (charging). If the value is 0MW, the battery was not active during the period.
This information is also available as a data table that breaks the asset's net power into imported MWs and exported MWs.
Note carefully that the battery's operation is shown in MWs. It's not clear whether this power value is a snapshot of the battery's operation at the end of the period or if the value is the average during the period.
Physical operations data is only available in 1-day view, but historical data is available.
Revenue breakdown
For whatever timeframe you've selected, the Revenue Breakdown section shows you the overall revenue ($/MW) for that time period broken down by component.
Throughput
Throughput is the total quantity of energy (MWh) exported by the battery during the period. Note that this is not net energy. All exported energy has to be imported first, as batteries do not produce net-new energy.
Cycles are the average number of times per day the battery exported power matched its storage capacity. The high-cycling / low-cycling bar below compares the battery's cycling behavior to the rest of the fleet.
Availability
Availability is the number, and percent, of hours in which the battery listed its status (in its Current Operating Plan) as available to operate during the chosen timeframe. The high-availability / low-availability bar below compares the battery's availability to the rest of the fleet. Note that:
- To determine asset availability, we pull data from the 60-Day SCED Disclosure Reports. We look at both the Generation Resource Data and the Load Resource Data, because batteries are modeled by ERCOT as both a generation and load resource.
- For both the generation and load resource data, we get the battery's status from the column "telemeteredResourceStatus". If the status is "OUT", "OUTL", "ONTEST", or not given in the data, it is marked as unavailable. Otherwise, it is available.
- For each 15-minute settlement period, a battery is marked as available if either its load or generation side are available during the period. Otherwise, it is unavailable.
Asset comparison
Click the scales icon underneath the "View Methodology" button to choose a different battery to compare against the battery you're currently viewing.
The comparison view is similar to the standard view, and the above explanations of each metric still apply. The only difference is that the revenue operation graph plots both asset's operations together and compares them with the 1-hour and 2-hour fleet-average benchmarks.
Updated 8 months ago